What’s the best, easiest way to house hunt in 2024?
Answers here


Orange County Market Report

September 2020 


If you’re thinking about selling your home, it's important to have a good understanding of what’s going on in the Orange County market.

Knowing the most important data such as the average sales price, number of homes sold, and days on market will better prepare you to sell your home.

Our market report showcases everything you need to know about local real estate trends.


205

Coming Soon

573

New Listings

4,139

Active Listings

2,339

Under Contract

2,098

Pending Sale

2,479

Closed Sales


$1,040,241

Average Sales Price

31

Average Days on Market

$503.66

Average Price Per Square Foot


Homes Sold

98%

Sale-to-List Price


Orange County Housing Report Summary

Courtesy of Steven Thomas 


  • The active listing inventory decreased by 39 homes in the past two-weeks, down 1%, and now totals 4,213, its lowest level for September since tracking began in 2004. COVID-19 is not suppressing the inventory and in the past four-weeks, there were 20%  more homes that came on the market compared to last year. This could be the beginning of a new trend. Last year, there were 6,860 homes on the market, 2,647 additional homes, or 63% more.


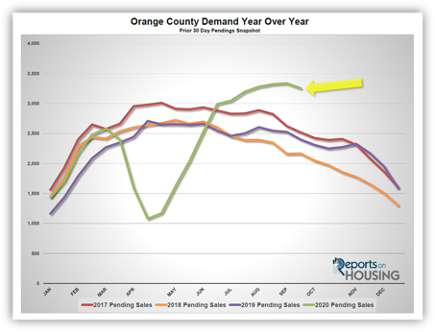
  • Demand, the number of pending sales over the prior month, decreased by 84 pending sales in the past two-weeks, down 3%, and now totals 3,256. It appears as if demand peaked two weeks ago. COVID-19 currently has no effect on demand. Last year, there were 2,401 pending sales, 26% fewer than today.


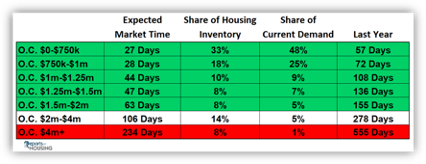
  • The Expected Market Time for all of Orange County increased from 38 days to 39, a Hot Seller’s Market (less than 60 days). It was at 86 days last year, much slower than today.


  • For homes priced below $750,000, the market is a hot Seller’s Market (less than 60 days) with an expected market time of 27 days. This range represents 33% of the active inventory and 48% of demand.


  • For homes priced between $750,000 and $1 million, the expected market time is 28 days, a hot Seller’s Market. This range represents 18% of the active inventory and 25% of demand.


  • For homes priced between $1 million to $1.25 million, the expected market time is 44 days, a hot Seller’s Market.


  • For luxury homes priced between $1.25 million and $1.5 million, in the past two weeks, the Expected Market Time decreased from 49 to 47 days. For homes priced between $1.5 million and $2 million, the Expected Market Time increased from 58 to 63 days. For luxury homes priced between $2 million and $4 million, the Expected Market Time increased from 97 to 106 days. For luxury homes priced above $4 million, the Expected Market Time increased from 222 to 234 days.


  • The luxury end, all homes above $1.25 million, accounts for 38% of the inventory and only 18% of demand.


Curious about what
your home is worth now?

We're able to explain what these numbers mean for you and your home's current market value. 

We use cookies to enhance your browsing experience and deliver our services. By continuing to visit this site, you agree to our use of cookies. More info